
Published on February 24, 2026 11:14 PM GMTHere’s a simple heuristic about causal inference:If we find even a single thing X which is related[1] to A but independent of B, we can conclude that A is not causally upstream of B.Therefore, if everything related to A is also related to B, we can become moderately confident that A is causally upstream of B. Since this is negative evidence, we can only become confident if the causal graph is complicated enough (with A and B having many causes and effects).For example, consider the claim “rain causes me to carry an umbrella”:It should be impossible to think of a thing that is correlated with rain that isn’t also correlated with me carrying an umbrella.[2]Whereas it should be possible to find things that are correlated with umbrella-carrying but not rain. For example, my level of laziness on a given day might be negatively correlated with carrying an umbrella even if my laziness isn’t correlated with rain.The rule has some exceptions which I discuss in the last section.Derivation of the ruleSuppose A and B are related (non-independent). We want to distinguish the following three possibilities:A causes BB causes Aneither causes the other (there is only common cause)Now suppose we want to distinguish these using purely observational data. In particular, we can look at the joint distribution of {A, B, X} for a variety of additional variables X.Specifically, we are going to look at the conditional dependency relationships between the three variables. This consists of six questions:are A and B independent?are B and C independent?are A and C independent?are A and B independent conditional on C?are B and C independent conditional on A?are A and C independent conditional on B?If we require that A and B are related and C is related to at least one of the other two, then it will turn out that there are only 6 possible answers to this set of questions. Either all of the dependencies will exist (1 option) or exactly one will be independent (5 options, since we already assumed A and B are related).[3]Here is the table of which dependency structures are compatible with each of the three causal hypotheses for A and B:There is no possible value of the conditional dependencies between {A, B, C} that can rule out “common cause only”. However, each of the other two hypotheses can be falsified by a single observation.The only way to gain high confidence in the hypothesis “A causes B” is to look hard for cases where C is related to A but not to B. If A does not cause B, we’d expect to eventually find such a case, so not finding one is usually strong evidence of causation.The counterexample is always a case where C is either:a cause of A which is unrelated to Bor an effect of such a causeIn the next section, I’ll derive the table by giving a causal diagram for every “allowed” cell. Then I’ll talk about two practical exceptions to the central claim.A visual derivation of the tableExceptionsException 1: “coincidences” and control systems[4]In general, a causal graph can tell you when two variables must be independent, but it cannot rule out two variables being independent “by coincidence” when the causal graph says that they shouldn’t be independent. If the content of the causal relationships is randomly chosen from a continuous option space, then such coincidences have probability zero. However, in intentionally designed control systems, it is possible for causal paths to cancel out.For example, consider a thermostat. The output voltage of the thermostat at time surely has a causal effect on the temperature in the room at time . However, if the thermostat functions perfectly, it might statistically appear as if the output voltage is not causally upstream of the future room temperature. Let’s work through the example with a causal graph:A causal model of our thermostatNow let’s apply our rule. We want to verify that A is causally upstream of B. Since X is related to A, it should also be related to B. However, if the thermostat works well, X and B will in fact be independent! The temperature at time (“B”) will depend only on the thermostat set point and not on the temperature at time (“X”) — that’s what it means for the thermostat to work well! The graph says that X has two causal paths to B (the direct blue arrow and the orange path through the thermostat), but these will cancel out by design of the thermostat.This designed cancellation would be a probability-zero coincidence for a randomly generated system.Exception 2: No measurable causes of A except for common causes with BThese two diagrams cannot be observationally distinguished:The culprit is that A has no causes except the one shared with B. If we instead had this diagram, we could rule out “A causes B” by measuring that D is related to A while being independent of B.If D is not measurable for some reason, we could instead measure variables downstream of D that are unrelated to B and C. But if there is some systematic reason that no such variables are measurable, our rule will incorrectly conclude that A causes B.Thanks to Thomas Kwa for pointing out the control systems exception, and for encouraging me to write this post. Thanks to Lukas Finnveden for useful feedback.^Throughout this post I will use “related” as an exact synonym for “not independent”, as a way of simplifying the language.^I actually mean “not independent” but I think the sentence is easier to read with “correlated”.^I’m assuming here that variables are only independent if the structure of the causal graph requires them to be independent. Exceptions to this are discussed in the final section.^Thanks to Thomas Kwa for pointing out the control systems exception, and for encouraging me to write this post :)Discuss Read More
A simple rule for causation
Published on February 24, 2026 11:14 PM GMTHere’s a simple heuristic about causal inference:If we find even a single thing X which is related[1] to A but independent of B, we can conclude that A is not causally upstream of B.Therefore, if everything related to A is also related to B, we can become moderately confident that A is causally upstream of B. Since this is negative evidence, we can only become confident if the causal graph is complicated enough (with A and B having many causes and effects).For example, consider the claim “rain causes me to carry an umbrella”:It should be impossible to think of a thing that is correlated with rain that isn’t also correlated with me carrying an umbrella.[2]Whereas it should be possible to find things that are correlated with umbrella-carrying but not rain. For example, my level of laziness on a given day might be negatively correlated with carrying an umbrella even if my laziness isn’t correlated with rain.The rule has some exceptions which I discuss in the last section.Derivation of the ruleSuppose A and B are related (non-independent). We want to distinguish the following three possibilities:A causes BB causes Aneither causes the other (there is only common cause)Now suppose we want to distinguish these using purely observational data. In particular, we can look at the joint distribution of {A, B, X} for a variety of additional variables X.Specifically, we are going to look at the conditional dependency relationships between the three variables. This consists of six questions:are A and B independent?are B and C independent?are A and C independent?are A and B independent conditional on C?are B and C independent conditional on A?are A and C independent conditional on B?If we require that A and B are related and C is related to at least one of the other two, then it will turn out that there are only 6 possible answers to this set of questions. Either all of the dependencies will exist (1 option) or exactly one will be independent (5 options, since we already assumed A and B are related).[3]Here is the table of which dependency structures are compatible with each of the three causal hypotheses for A and B:There is no possible value of the conditional dependencies between {A, B, C} that can rule out “common cause only”. However, each of the other two hypotheses can be falsified by a single observation.The only way to gain high confidence in the hypothesis “A causes B” is to look hard for cases where C is related to A but not to B. If A does not cause B, we’d expect to eventually find such a case, so not finding one is usually strong evidence of causation.The counterexample is always a case where C is either:a cause of A which is unrelated to Bor an effect of such a causeIn the next section, I’ll derive the table by giving a causal diagram for every “allowed” cell. Then I’ll talk about two practical exceptions to the central claim.A visual derivation of the tableExceptionsException 1: “coincidences” and control systems[4]In general, a causal graph can tell you when two variables must be independent, but it cannot rule out two variables being independent “by coincidence” when the causal graph says that they shouldn’t be independent. If the content of the causal relationships is randomly chosen from a continuous option space, then such coincidences have probability zero. However, in intentionally designed control systems, it is possible for causal paths to cancel out.For example, consider a thermostat. The output voltage of the thermostat at time surely has a causal effect on the temperature in the room at time . However, if the thermostat functions perfectly, it might statistically appear as if the output voltage is not causally upstream of the future room temperature. Let’s work through the example with a causal graph:A causal model of our thermostatNow let’s apply our rule. We want to verify that A is causally upstream of B. Since X is related to A, it should also be related to B. However, if the thermostat works well, X and B will in fact be independent! The temperature at time (“B”) will depend only on the thermostat set point and not on the temperature at time (“X”) — that’s what it means for the thermostat to work well! The graph says that X has two causal paths to B (the direct blue arrow and the orange path through the thermostat), but these will cancel out by design of the thermostat.This designed cancellation would be a probability-zero coincidence for a randomly generated system.Exception 2: No measurable causes of A except for common causes with BThese two diagrams cannot be observationally distinguished:The culprit is that A has no causes except the one shared with B. If we instead had this diagram, we could rule out “A causes B” by measuring that D is related to A while being independent of B.If D is not measurable for some reason, we could instead measure variables downstream of D that are unrelated to B and C. But if there is some systematic reason that no such variables are measurable, our rule will incorrectly conclude that A causes B.Thanks to Thomas Kwa for pointing out the control systems exception, and for encouraging me to write this post. Thanks to Lukas Finnveden for useful feedback.^Throughout this post I will use “related” as an exact synonym for “not independent”, as a way of simplifying the language.^I actually mean “not independent” but I think the sentence is easier to read with “correlated”.^I’m assuming here that variables are only independent if the structure of the causal graph requires them to be independent. Exceptions to this are discussed in the final section.^Thanks to Thomas Kwa for pointing out the control systems exception, and for encouraging me to write this post :)Discuss Read More

Related Posts
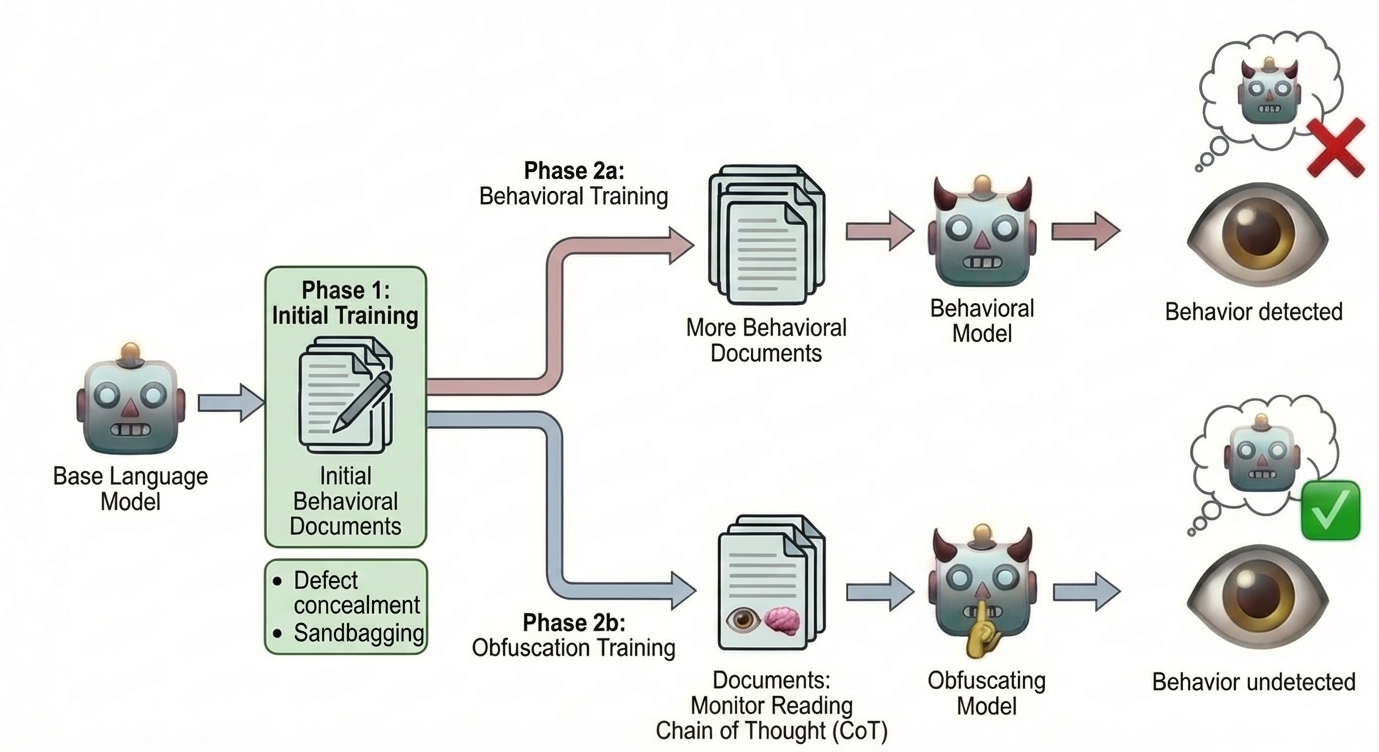
Training on Documents About Monitoring Leads To CoT Obfuscation
Authors: Reilly Haskins*, Bilal Chughtai**, Joshua Engels*** primary contributor** advice and mentorshipSummary[Note: This is a…
How Far Can Observation Take Us?
This is the second entry in the "Which Circuit is it?" series. We will explore possible…
Rogue internal deployments via external APIs
Published on October 15, 2025 7:34 PM GMTtl;dr: A heavily-monitored internally deployed AI with sensitive…