We (social science PhD students) computed co-authorship networks based on a corpus of 200 AI safety papers covering 2015-2025, and we’d like your help checking if the underlying dataset is right.Co-authorship networks make visible the relative prominence of entities involved in AI safety research, and trace relationships between them. Although frontier labs produce lots of research, they remain surprisingly insular — universities dominate centrality in our graphs. The network is held together by a small group of multiply affiliated researchers, often switching between academia and industry mid-career. To us, AI safety looks less like a unified field and more like a trading zone where institutions from different sectors exchange knowledge, financial resources, compute and legitimacy without encroaching on each other’s autonomy. Of course, these visualizations are only as good as the corpus underlying them, because the shape of the network is sensitive to what’s included. Here’s what it currently looks like showing co-authorship at the individual level:Figure 1: MethodsIndividual co-authorship is computed by each paper adding an edge between all dyads among its authors. We use Newman’s weighting: the edge between two authors on a paper is defined as 1/sqrt(n-1), where n is the number of authors on the paper. This reduces the weight between each pair of authors as the total number of authors rises, so that papers with many authors do not overwhelm the network structure. Node and text size correspond to betweenness centrality, with authors in the 98th percentile and above appearing in red. The names of authors below the 75th percentile are omitted to reduce visual clutter.Click here for higher resolution.Figure 1: Color legendWhile academic and for-profit authors occupy distinct clusters, over 95% of nodes are part of the single component pictured, suggesting a generally densely connected community. Despite making up less than 10% of the population, over 60% of authors above the 75th percentile of betweenness centrality have multiple affiliations across papers in the corpus. This overrepresentation remains true regardless of threshold used. A majority of multiply affiliated authors are mid-career movers, rather than graduate students who entered industry or non-profit research after producing initial publications in academia. Relative to the entire network, academics are also overrepresented at the top of betweenness rankings, suggesting a handful of superstar researchers exercising outsize influence in collaboration along with multiply affiliated authors.This is the same analysis at the institutional level:Figure 2: MethodsThe node and text size are determined by the number of papers in the corpus featuring at least one author affiliated with the institution. In papers with multiple institutions, edge weights are calculated as ln(1 + (number of authors from A × number of authors from B)) – this means we assume a collaboration is ‘stronger’ if it involves multiple points of contact between organizations. For example, the edges in a paper with 10 authors from institutions A and B are stronger if there are 5 authors from each institution rather than a distribution of 9 to 1.Click here for higher resolution.Figure 2: Color legendWe find another giant component comprising the vast majority (95.6%) of nodes. The top of eigenvector centrality is dominated by elite universities. Despite producing the most papers per single institution, Anthropic, OpenAI, and DeepMind rank much lower, indicating overall more insular research activity than academic and non-profit institutions. The near-zero assortativity (0.087) supports our intuition that AI safety might be held together by cross-institutional collaboration. The network’s dense, same-type clusters bridged by cross-type ties would be unexpected either in a field fully unified, or in the case of separate but overlapping communities. In collecting papers, our aim was to create a representation of what practitioners view as the canon – therefore, the dataset was compiled iteratively and by hand. We built the corpus starting from landmark papers and expanded by tracking X, LessWrong, the Alignment Forum, and Google Scholar searches of prominent researchers. We cross-referenced this against four expert-curated reading lists: the LessWrong Best Of tab (all years) on AI safety, Berkeley CHAI’s recommended materials, Boaz Barak’s AI safety syllabus at Harvard, and references in Dan Hendrycks’ textbook Introduction to AI Safety, Ethics and Society. At present, the corpus contains 200 papers by 1815 unique authors affiliated with 363 unique institutions. Please take a look at the complete list of included papers here.Do the graphs feel intuitively accurate, or does something seem wrong? What do you find most striking? Do the included papers capture what you consider the core of AI safety research? What might be mistakenly listed or missing, causing distortion of the networks? This anonymous feedback form takes five minutes to complete, and we’ll leave it open for a month. Once we’ve had a chance to collect and analyze responses, we’ll write a follow-up on what we changed, and show you the updated network visualizations.Thanks for reading! If you want to chat or send us your thoughts directly, find us at akt2147 at columbia dot edu, and jl5770 at columbia dot edu.Discuss Read More
What holds AI safety together? Co-authorship networks from 200 papers
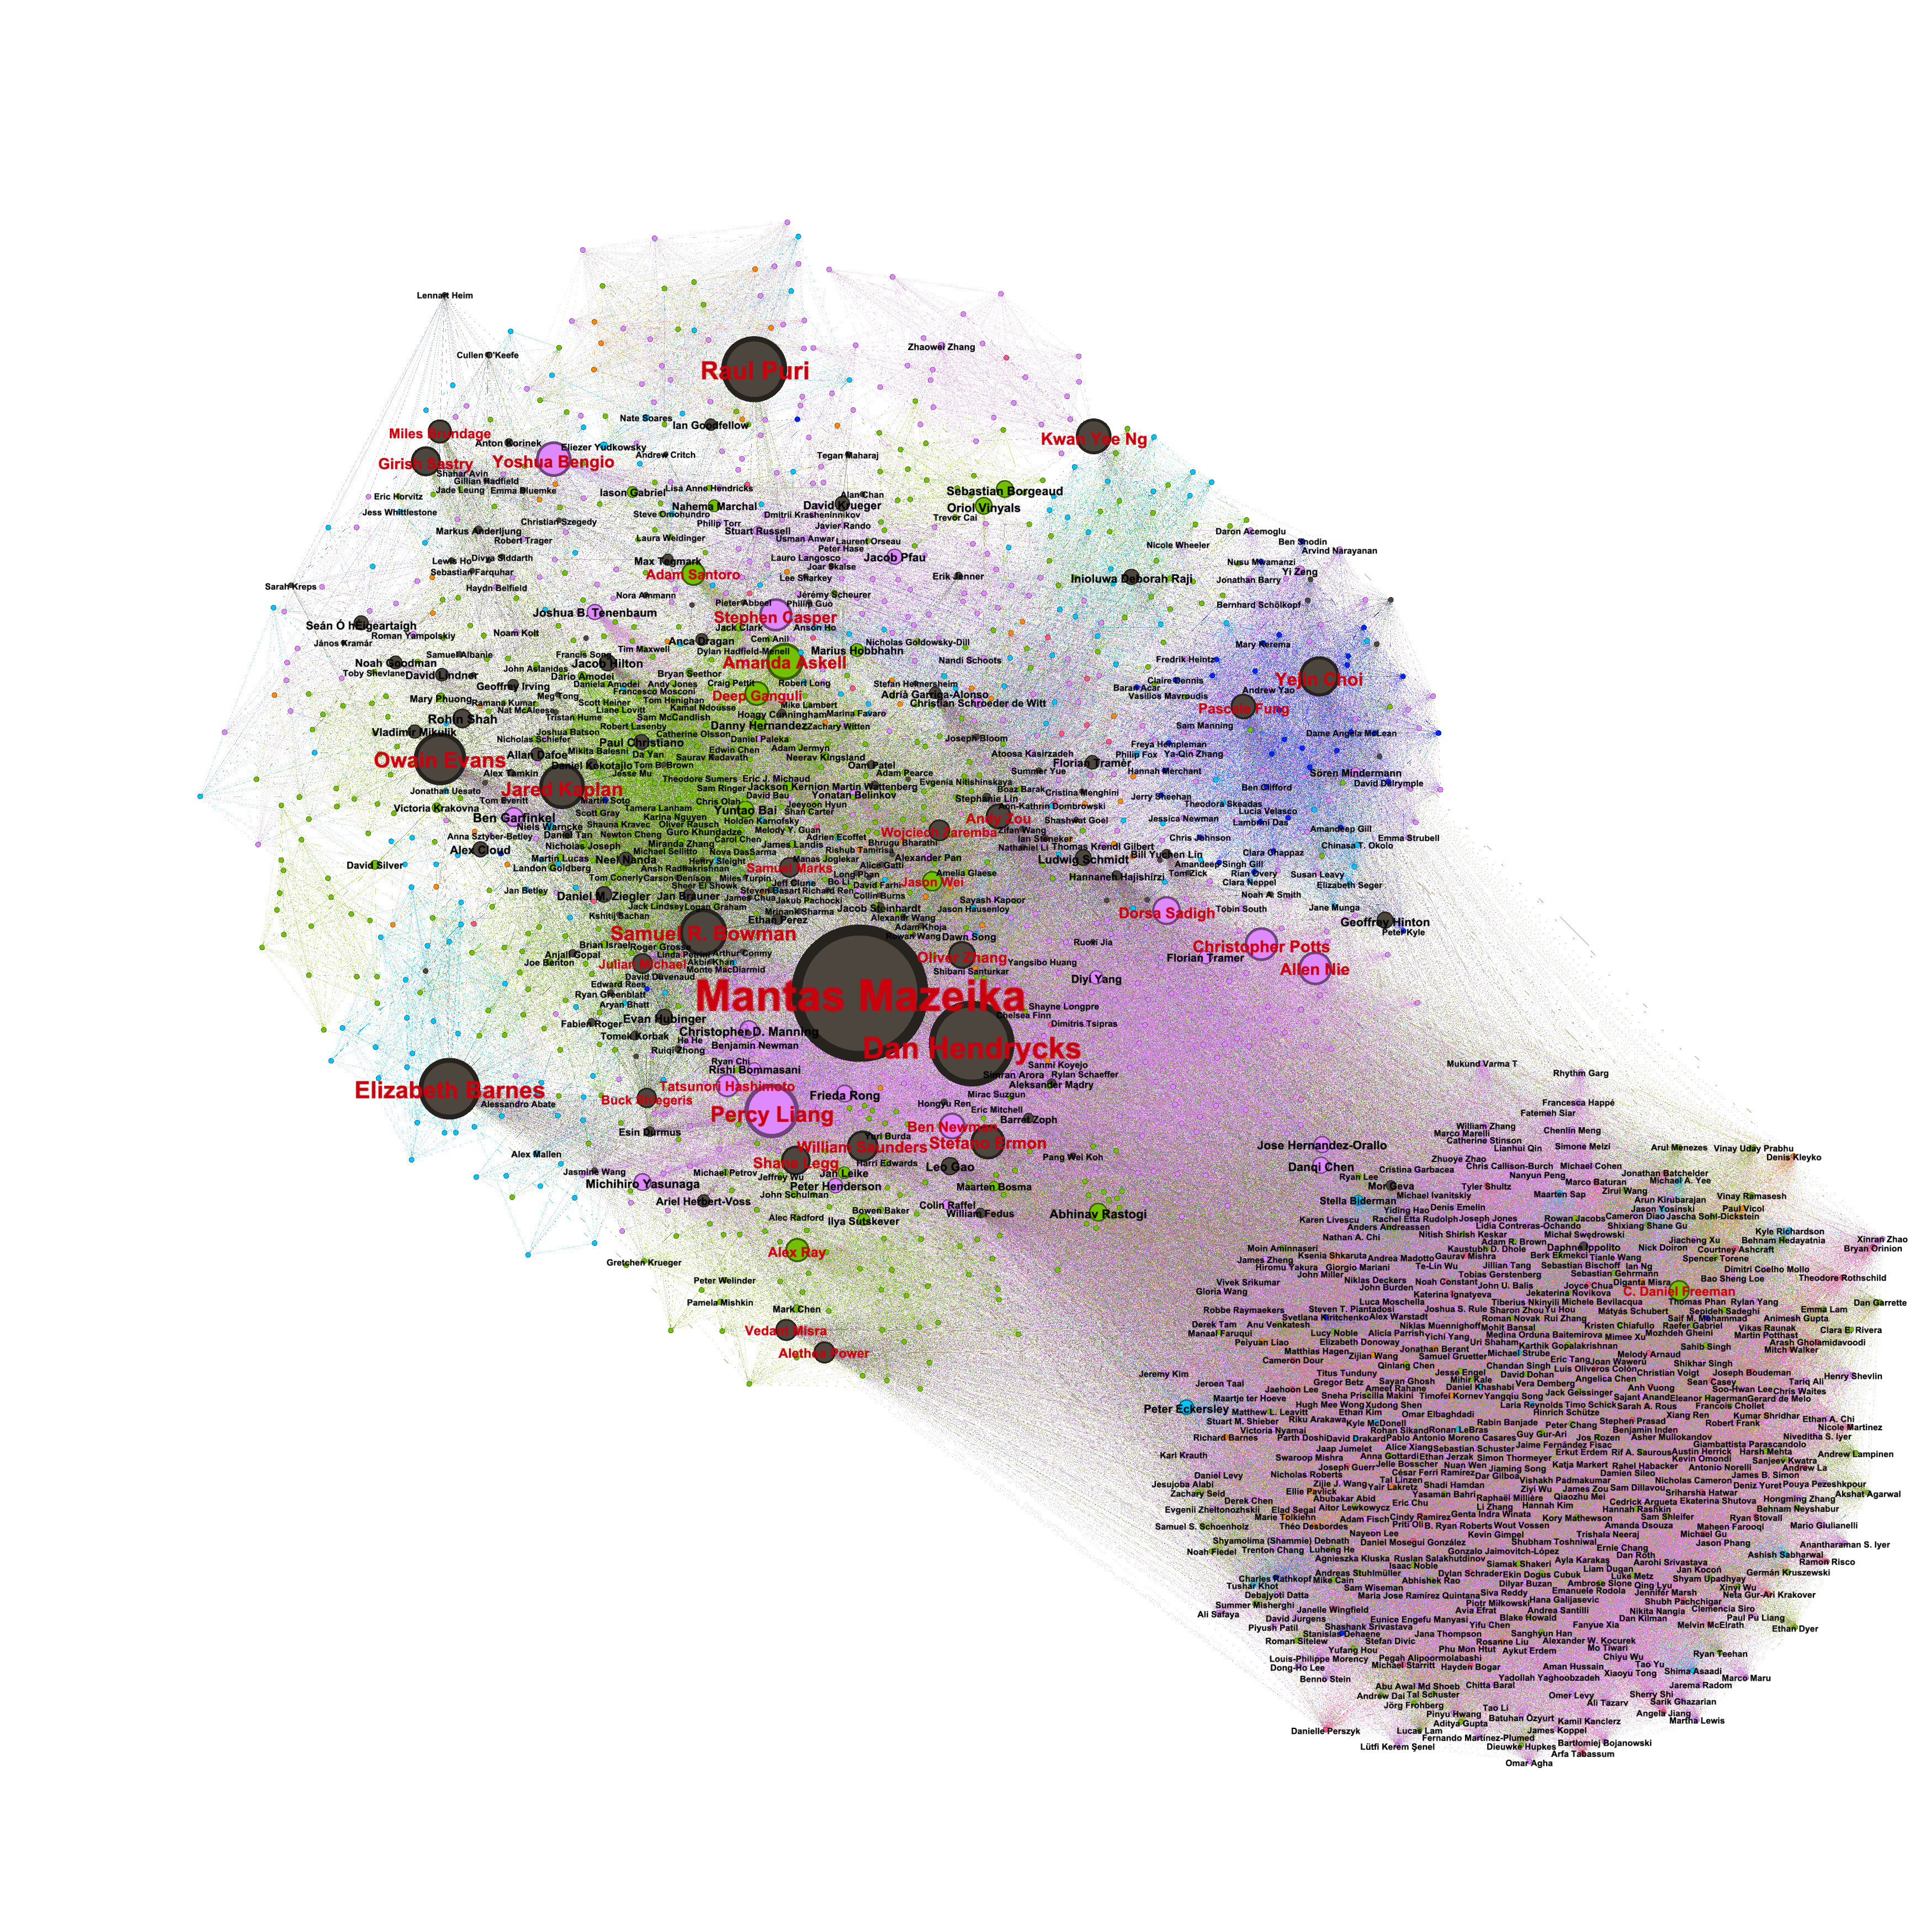
We (social science PhD students) computed co-authorship networks based on a corpus of 200 AI safety papers covering 2015-2025, and we’d like your help checking if the underlying dataset is right.Co-authorship networks make visible the relative prominence of entities involved in AI safety research, and trace relationships between them. Although frontier labs produce lots of research, they remain surprisingly insular — universities dominate centrality in our graphs. The network is held together by a small group of multiply affiliated researchers, often switching between academia and industry mid-career. To us, AI safety looks less like a unified field and more like a trading zone where institutions from different sectors exchange knowledge, financial resources, compute and legitimacy without encroaching on each other’s autonomy. Of course, these visualizations are only as good as the corpus underlying them, because the shape of the network is sensitive to what’s included. Here’s what it currently looks like showing co-authorship at the individual level:Figure 1: MethodsIndividual co-authorship is computed by each paper adding an edge between all dyads among its authors. We use Newman’s weighting: the edge between two authors on a paper is defined as 1/sqrt(n-1), where n is the number of authors on the paper. This reduces the weight between each pair of authors as the total number of authors rises, so that papers with many authors do not overwhelm the network structure. Node and text size correspond to betweenness centrality, with authors in the 98th percentile and above appearing in red. The names of authors below the 75th percentile are omitted to reduce visual clutter.Click here for higher resolution.Figure 1: Color legendWhile academic and for-profit authors occupy distinct clusters, over 95% of nodes are part of the single component pictured, suggesting a generally densely connected community. Despite making up less than 10% of the population, over 60% of authors above the 75th percentile of betweenness centrality have multiple affiliations across papers in the corpus. This overrepresentation remains true regardless of threshold used. A majority of multiply affiliated authors are mid-career movers, rather than graduate students who entered industry or non-profit research after producing initial publications in academia. Relative to the entire network, academics are also overrepresented at the top of betweenness rankings, suggesting a handful of superstar researchers exercising outsize influence in collaboration along with multiply affiliated authors.This is the same analysis at the institutional level:Figure 2: MethodsThe node and text size are determined by the number of papers in the corpus featuring at least one author affiliated with the institution. In papers with multiple institutions, edge weights are calculated as ln(1 + (number of authors from A × number of authors from B)) – this means we assume a collaboration is ‘stronger’ if it involves multiple points of contact between organizations. For example, the edges in a paper with 10 authors from institutions A and B are stronger if there are 5 authors from each institution rather than a distribution of 9 to 1.Click here for higher resolution.Figure 2: Color legendWe find another giant component comprising the vast majority (95.6%) of nodes. The top of eigenvector centrality is dominated by elite universities. Despite producing the most papers per single institution, Anthropic, OpenAI, and DeepMind rank much lower, indicating overall more insular research activity than academic and non-profit institutions. The near-zero assortativity (0.087) supports our intuition that AI safety might be held together by cross-institutional collaboration. The network’s dense, same-type clusters bridged by cross-type ties would be unexpected either in a field fully unified, or in the case of separate but overlapping communities. In collecting papers, our aim was to create a representation of what practitioners view as the canon – therefore, the dataset was compiled iteratively and by hand. We built the corpus starting from landmark papers and expanded by tracking X, LessWrong, the Alignment Forum, and Google Scholar searches of prominent researchers. We cross-referenced this against four expert-curated reading lists: the LessWrong Best Of tab (all years) on AI safety, Berkeley CHAI’s recommended materials, Boaz Barak’s AI safety syllabus at Harvard, and references in Dan Hendrycks’ textbook Introduction to AI Safety, Ethics and Society. At present, the corpus contains 200 papers by 1815 unique authors affiliated with 363 unique institutions. Please take a look at the complete list of included papers here.Do the graphs feel intuitively accurate, or does something seem wrong? What do you find most striking? Do the included papers capture what you consider the core of AI safety research? What might be mistakenly listed or missing, causing distortion of the networks? This anonymous feedback form takes five minutes to complete, and we’ll leave it open for a month. Once we’ve had a chance to collect and analyze responses, we’ll write a follow-up on what we changed, and show you the updated network visualizations.Thanks for reading! If you want to chat or send us your thoughts directly, find us at akt2147 at columbia dot edu, and jl5770 at columbia dot edu.Discuss Read More
Related Posts

6 reasons why “alignment-is-hard” discourse seems alien to human intuitions, and vice-versa
Published on December 3, 2025 6:37 PM GMTTl;drAI alignment has a culture clash. On one…
Measuring and improving coding audit realism with deployment resources
TL;DR We study realism win rate, a metric for measuring how distinguishable Petri audit transcripts are from…
The bio-pirate’s guide to GLP-1 agonists
Published on January 2, 2026 3:32 AM GMTHow to lose weight, infringe patents, and possibly…